Metrics are one of the most powerful parts of CoachAccountable. By measuring progress, you increase the chances of tangible results. CoachAccountable allows you to apply the performance-tracking and habit-forming potential of Metrics on a group level through Group Metrics.
Group Metrics are useful for a coaching group in which all or some members are working at the same Metric. Examples include:
- A group fitness program in which members are each tracking their weight and/or daily exercise.
- A sales team in which all members are pulling towards an office-wide sales goal.
- A real estate team concerned with tracking performance measures such as number of appointments, showings, and touch points.
Group Metrics work how you think they would: as group members report their numbers over the passage of time, the Group Metric average or sum is automatically calculated to show the updated state of things, visible at any time to you (and potentially your client group members).
Group Metrics are created from a Group Page. Click the + icon on the Group Stream menu to get started:
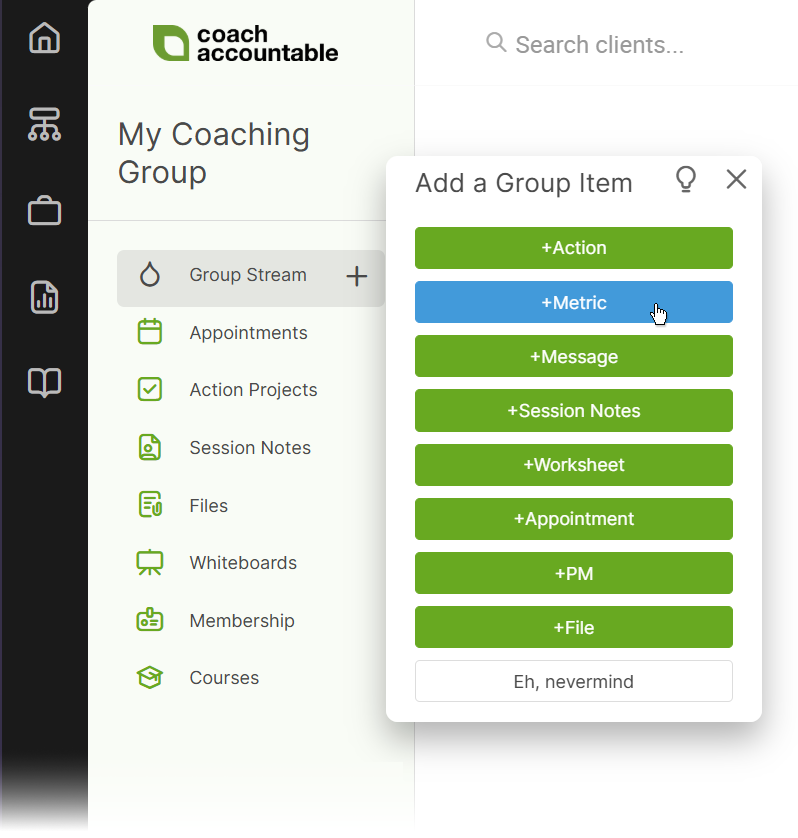
When you click +Metric, the usual wizard will guide you through the process. It's what you'd expect, plus 3 key differences:
- The "Who" step - This allows you to choose which group members will be participating in the Group Metric ("All members of the group" is the most common choice, but when you need to, this allows you to let certain members sit this one out!)
- Individual Target Values - The target you set for the Group Metric will apply to all participating members, BUT you have the option to check the "Allow individuals to set their own target values.", which makes the default group targets overridable for individuals.
- How to group data - In the Fine Tuning area, you can choose to group the data as the AVERAGE or the SUM of individual data points. This determines how the data will be computed and displayed for the overall Group Metric. For example:
If you choose to show the sum, the overall graph will show the total for each data point. For example, if person A enters 1, person B enters 2, and person C enters 3, the graph will show 6 for that day
If you choose to show the average, the graph will show 2 for that day, since 2 is the average of 1, 2, and 3. - Client Visibility - Like the other items you create for a Group, Metrics allow you to set the visibility level.
Let’s look at a few examples to examine how Group Metrics foster higher engagement & performance.
Example: Regular Exercise
Say a fitness program challenges its participants to exercise regularly during the week, 3 times per week at least. Let’s set this up as a Group Metric.
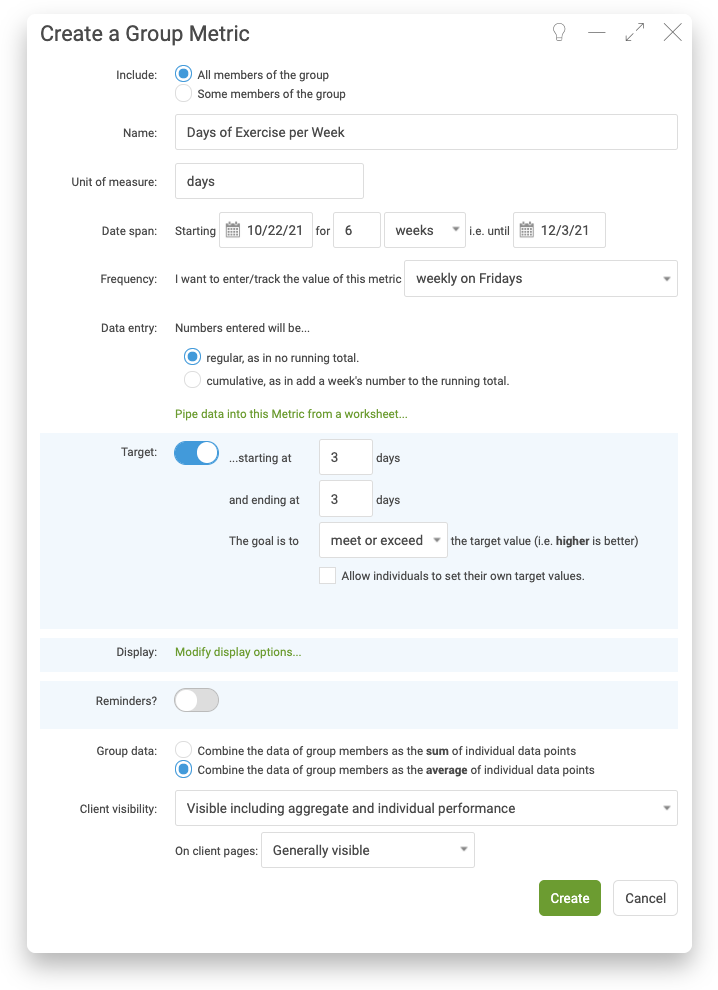
We make it include all members of the group, and the unit of measure is days, as in “how many days did you exercise this week?”. Say this is a six-week program, so we’ll have this span six weeks. If we start the Group Metric on a Friday and choose weekly for the "how often?" question, we set member up to report weekly on Fridays. We’re NOT doing a running total, and we declare the goal is to exercise 3 times a week. Accordingly our target will begin at 3 and end at 3. In other words: in the first week as well as in the last, exercising 3 times per week is the goal, and more is better.
We choose to group the data as an average so we can see how the group is overall stacking up against the 3-times-per-week goal, and we’ve set client visibility to include aggregate plus individual performance, meaning they’ll be able to see that group average as numbers get reported, as well as peek into everyone else’s graph. (A key part of this is that group members know that everyone else can look into their graph, which can add some nice friendly competition.)
After a few weeks of tracking data, here’s how things look:
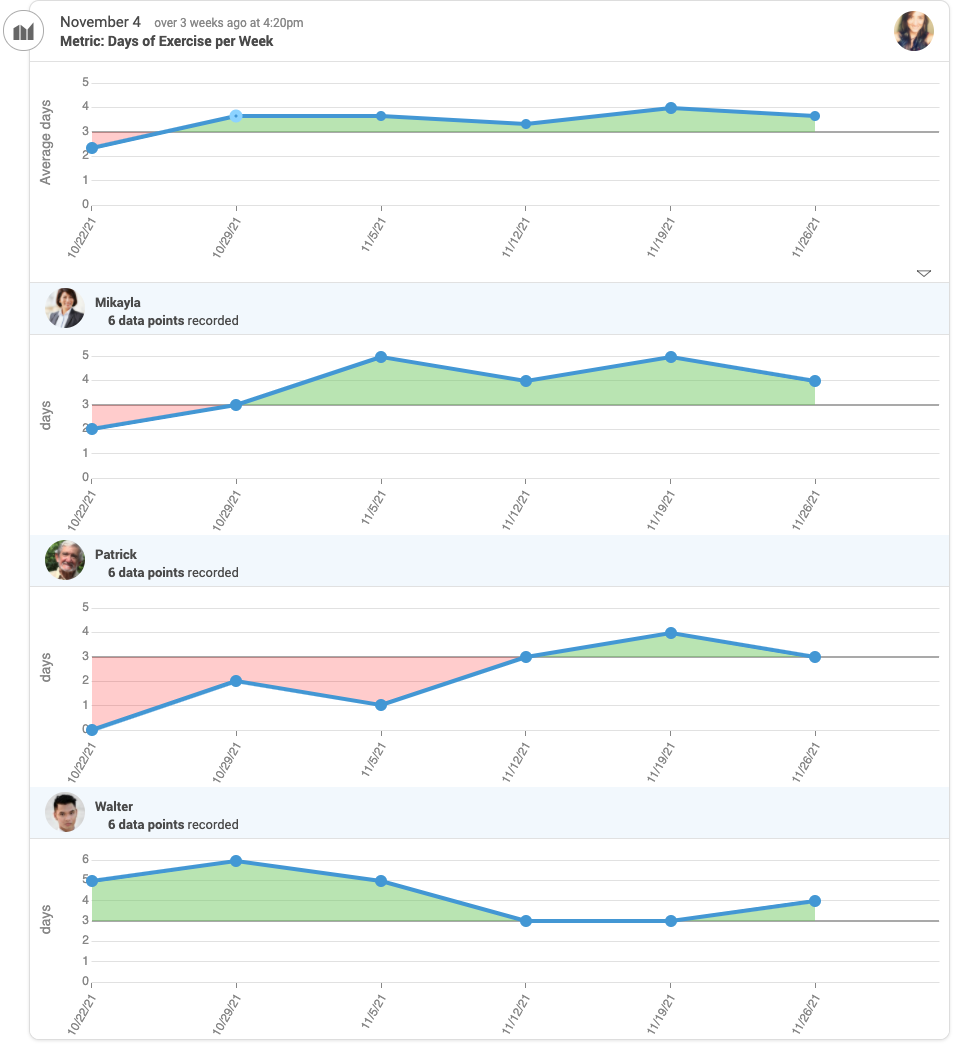
Think about having this sort of data organized like this as coach: you know exactly who’s thriving and who’s struggling, and can give meaningful and insightful coaching to both the group and specific individuals because of it. The at-a-glance comparison among group members also gives you an immediate sense how feasible (or not!) a given target really is, allowing you to tune accordingly when needed (after all, if EVERYONE’s in the red zone…).
Example: A Shared Sales Goal
Say a sales team of 4 agents wants to collectively cause $100,000 in sales over the course of a month. Let’s set that up:
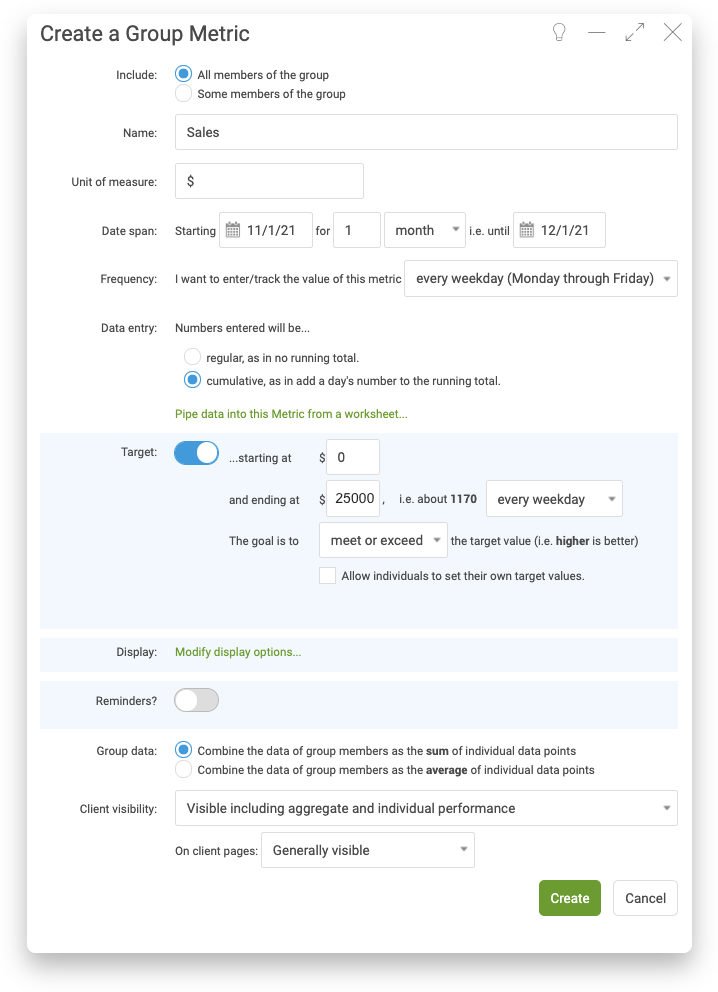
We’ve chosen to group the data as the sum of individual data points, and so here we have to do a little math: since there are four members of the group, each should have an individual target of $25,000 in order to have a group total goal of $100,000.
The reporting frequency is set to be every weekday to prompt the group members to report on each business day.
Under Data entry we've chosen the cumulative option, as this is a matter of daily reported sales numbers each contributing to a running total for the month.
Here’s how this could play out after a few weeks:
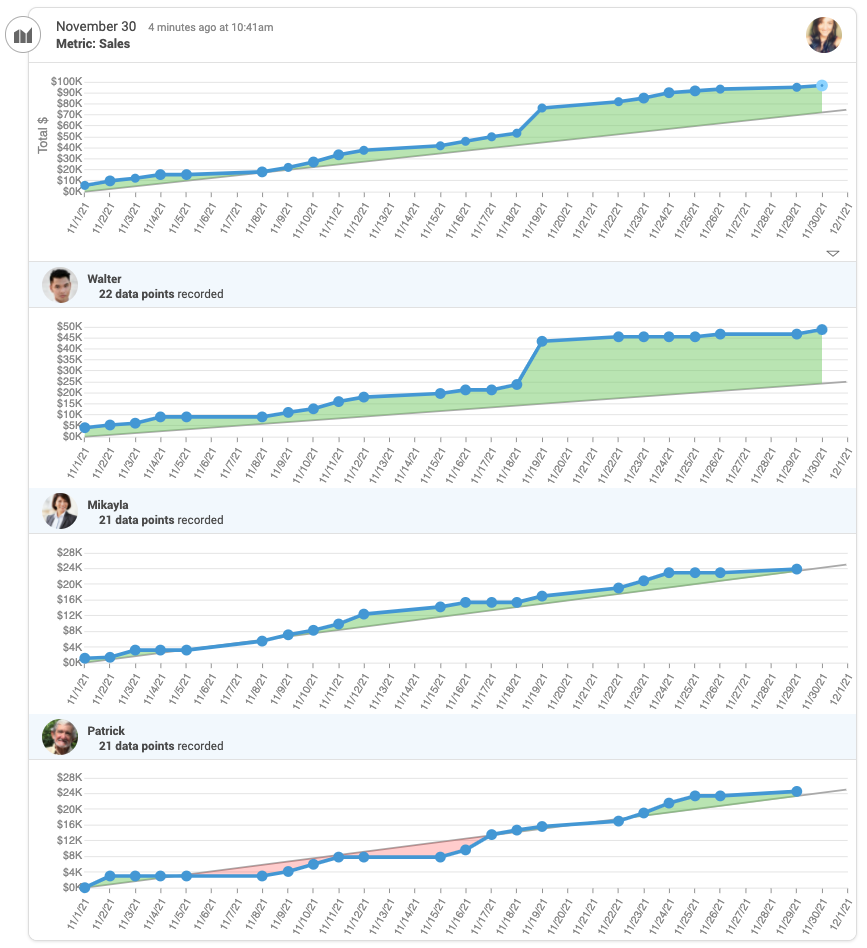
The summed performance of the group can be seen at the top: at-a-glance you can see that the group is on track to make the overall goal. Data points can also be conveniently seen for each individual: Walter stands out as having really excelled relative to his individual goal, and Patrick can be seen easily as being under during the first couple weeks. (Better yet: in practice you as coach would be able to detect this almost immediately, and have the opportunity to intervene and/or offer support way sooner than 2 weeks in.)
You have the option of whether or not to make all individual performance visible to all other group members. While not always appropriate, this can be a great way to cause a useful sort of peer pressure to perform: everyone knows their own numbers are subject to scrutiny by other group members. In the best case this can create a very healthy sort of contest among participants, spurring on a sort of one-upping that elevates the group as a whole.
Tiny Habits
A Group Metric can be an effective way to instill a useful practice into your coaching groups. Say for example you’d like all of your group members to, for the next month, take on the practice of meditating daily.
Here’s the setup:
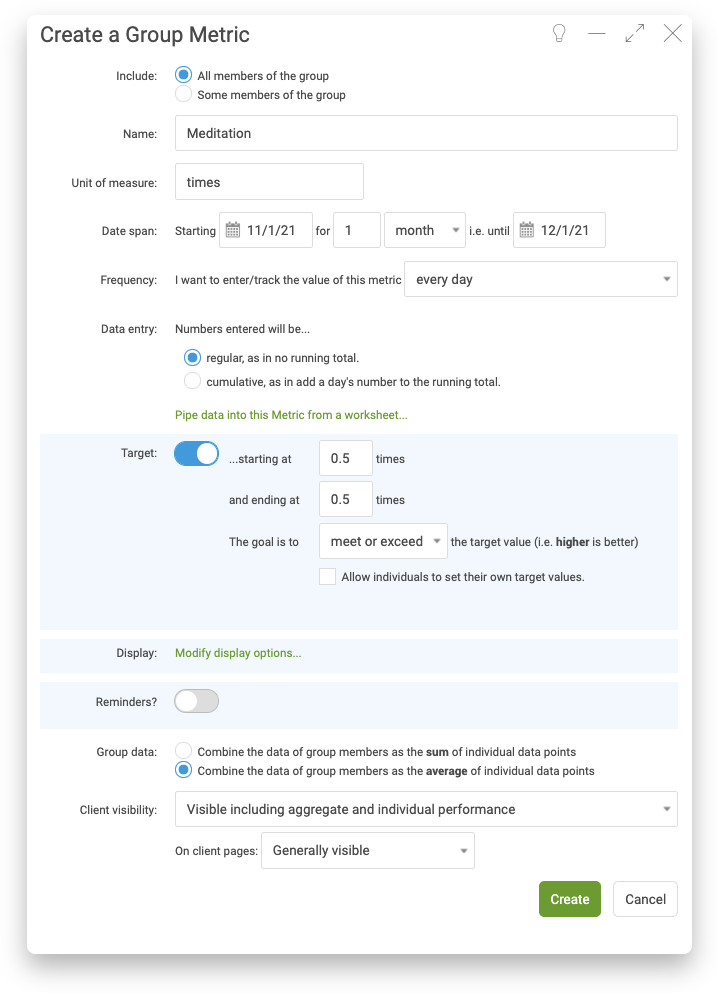
Tracking a regular practice is a good candidate for a Binary Metric, wherein the measurement is simply a “did you do it or didn’t you”, 1=YES and 0=NO.
Here’s how the Metric looks a few weeks in:
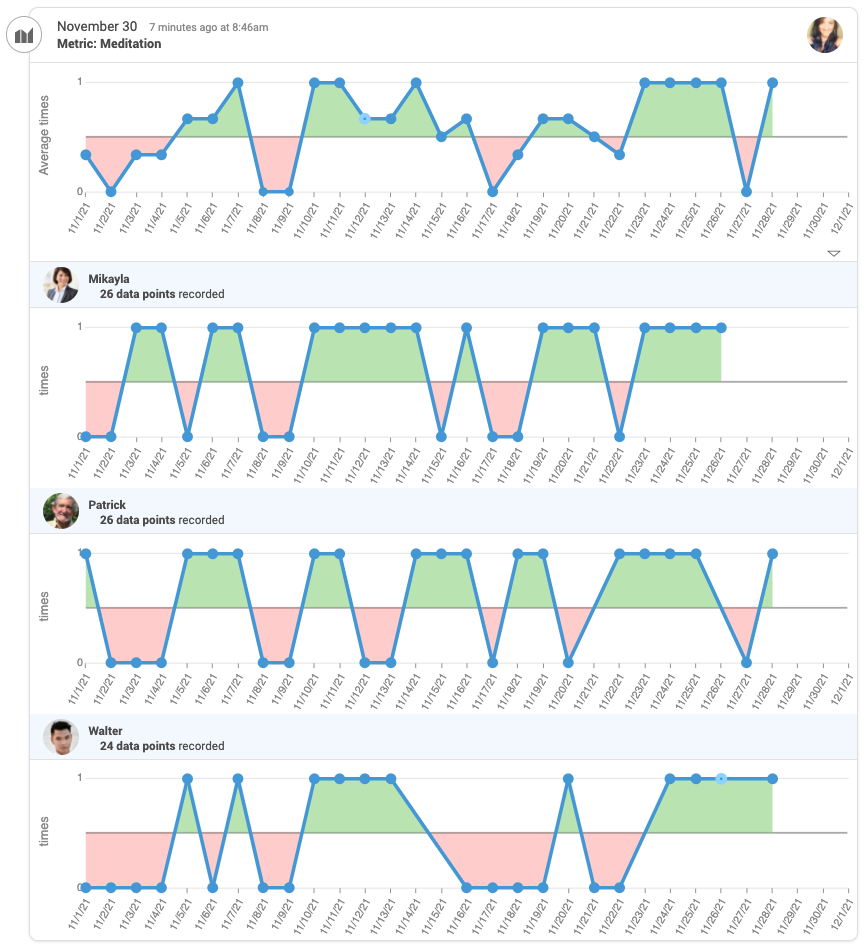
As with other Metrics that have a target, what’s powerful about a Group Metric is that no one wants to be the one with lots of red on their graph. It’s a subtle (but effective!) nudge to keep members keeping up.
Group Metrics accommodate a wide variety of group performance scenarios. To summarize, these are the key benefits to using them:
- Manage performance of the whole team thanks to detailed awareness of what’s going on with everyone.
- See the aggregate performance of the whole team, always calculated for you up-to-date.
- Transparency among group members of the collective (and optionally, individual) performance which pulls for individual accountability.