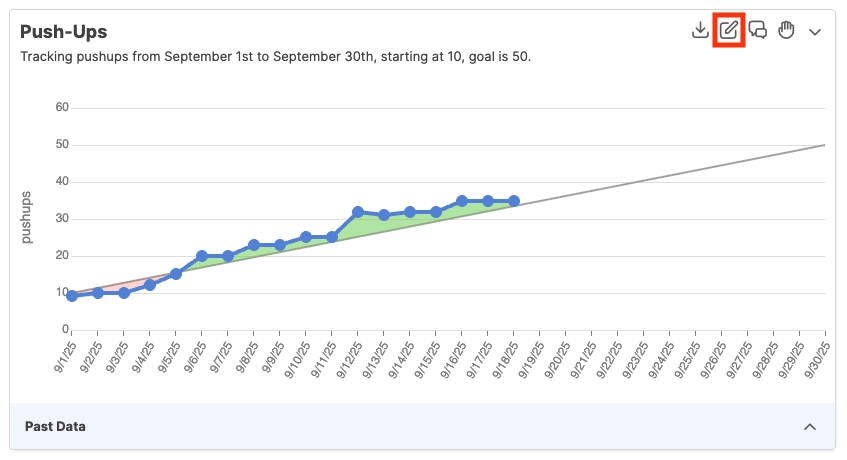
CoachAccountable Metrics is meant to give a visual representation of your clients' performance towards some predetermined target. Seeing one's performance in real time is a powerful thing. It's important to present the data in a way that's easily understandable, and that keeps a client focused and motivated.
The way the graph looks matters: A steeper trend line makes progress more dramatic. A graph that shows only a few days into the future can be effective in reminding your client to truly take a task one day at a time. You can change a Metric's display options both during and after setup.
Changing a Metric's display options
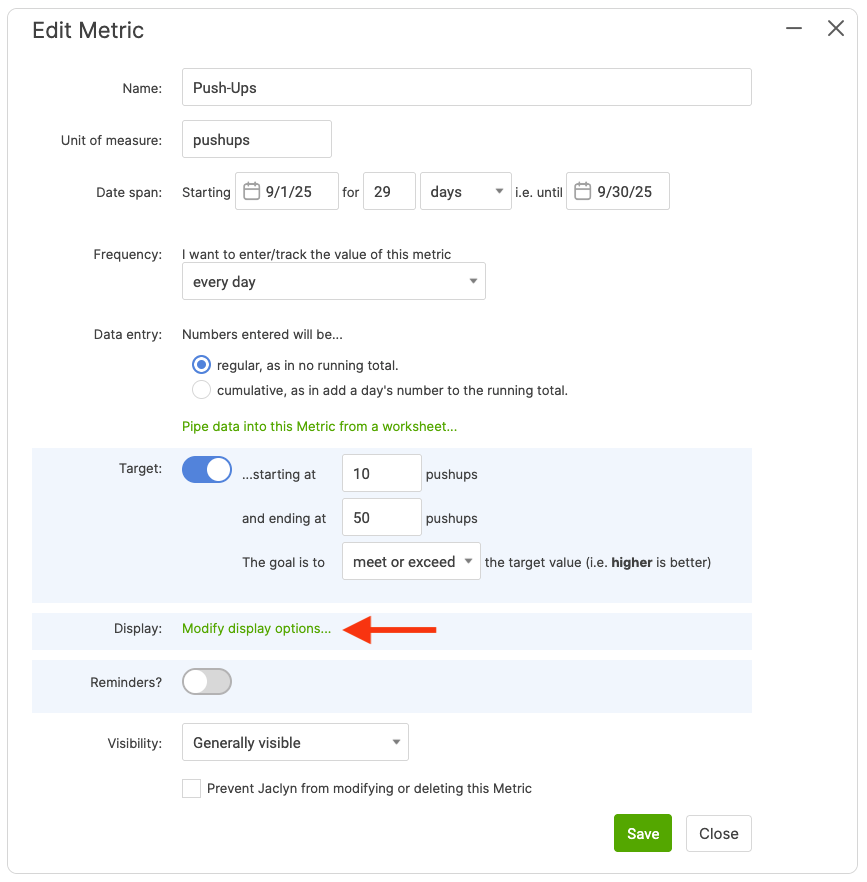
You can change a Metric's display options when first setting up a Metric and when editing one. To edit a Metric, click the Edit a Metric button for a specific Metric.
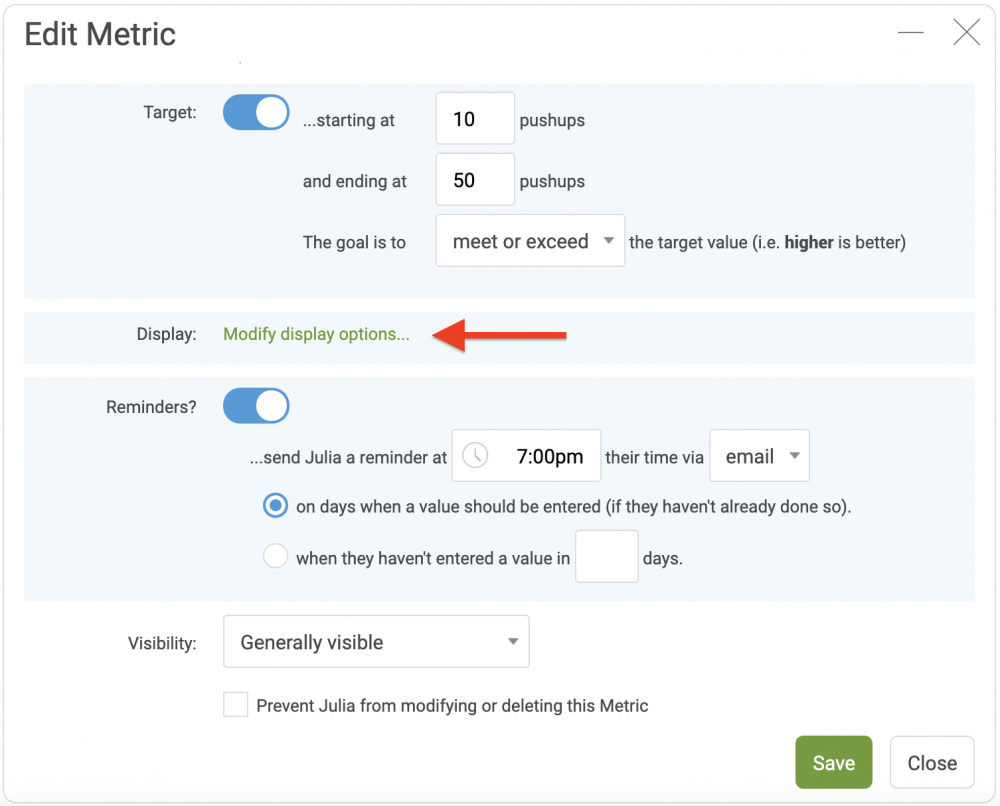
Then, scroll down to the Target section and click Modify display options.
The window will expand, and you will be presented with a few different options.
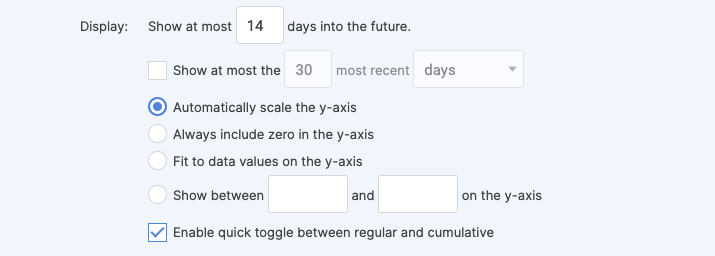
Though the effects of these options will vary based on the type of Metric you're tracking, and your current data, here's a general description of what they do:
Show at most X days into the future - This lengthens or shortens the graph based on how far into the future you want to display.
Automatically scale the y-axis - The default option adjusts the vertical axis based on a combination of your target trend line, current data, and how far into the future you choose to display.
Always include zero in the y-axis - No matter how large or small your Target or current data are, zero will always be included. This could lead to a stretched-out graph with tiny headings if any of the numbers are far from zero.
Fit to data values on the y-axis - This sets the upper limit of your y-axis to your highest value and the lower limit of the y-axis to your lowest value. You can use this option to make your target trend line steeper, which makes progress look more dramatic.
Show between X and Y on the y-axis - This option allows you to set the upper and lower limit of the graph to values of your choice. You can also use this option to make your target trend line steeper.
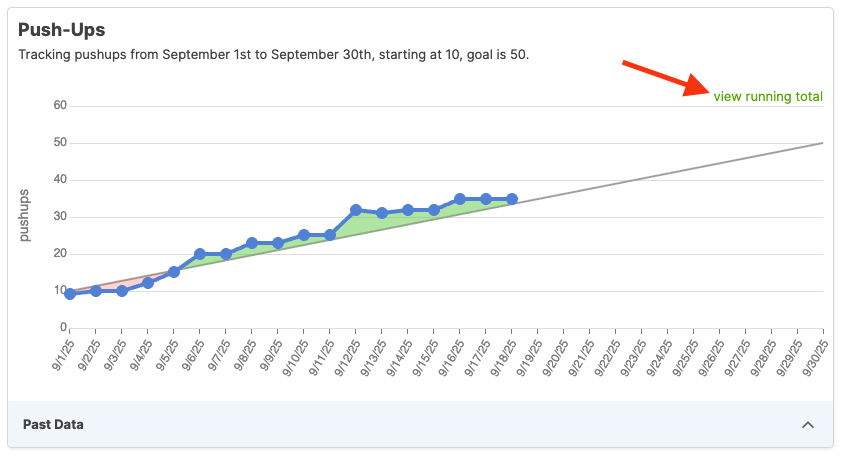
Enabling the quick toggle between regular and cumulative makes a link appear, and when clicked, allows you to quickly toggle between the two data entry settings:
By default, CoachAccountable takes its best shot at displaying a Metric. If the graph doesn't look exactly right, don't be afraid to play around with the display options.