The Coach Touchpoints report allows you to see, at a glance, how often you make contact with your clients (or for Team Edition, how often all your coaches do so). Here’s how to set it up.
You’ll find this in Reports >> Coach Touchpoints.
Generating a Touchpoints Report
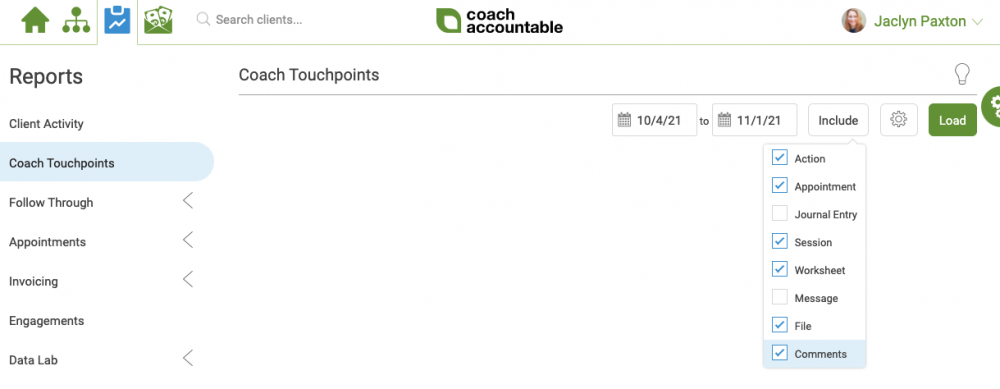
The real essence of a Touchpoints report is the date range you’re interested in and what kinds of interactions you want to be included. Clicking on the “Include” button reveals the types of interactions that you can choose from.
There are also a few less essential (but handy) settings to be found by clicking the gear icon:
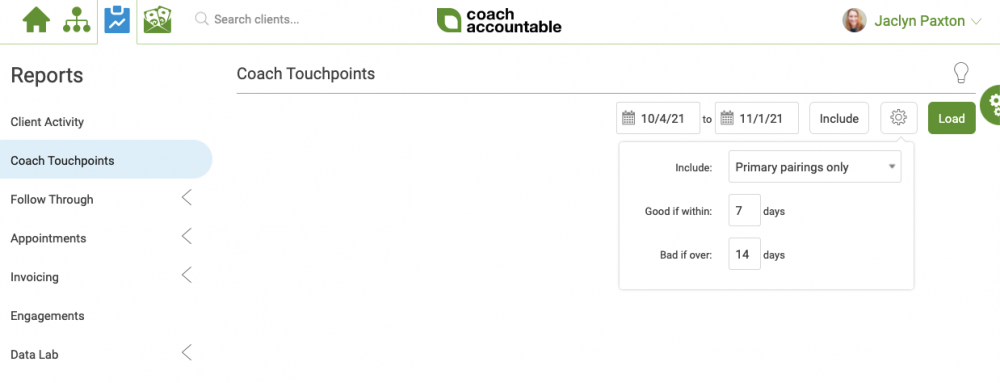
For Team Edition accounts, you can choose to include secondarily-paired clients (in addition to primary ones) when visualizing who coaches have (and haven’t) been active with.
The “Good if within” and “Bad if over” settings affect how things are color coded. Ultimately this report is meant to give a visual look into how often you are interacting with clients, and if it’s frequent enough.
The resulting colorful graph will show trends in your interaction with clients, broken down by coach for Team Edition users, or just you if it’s, well, just you. This can help you keep tabs on how you and/or your coaches are doing, and who might need a little more rigor in their outreach and upkeep.
Let’s take a look at one for a Team Edition account (solo coaches, scroll down to see an example of yours).
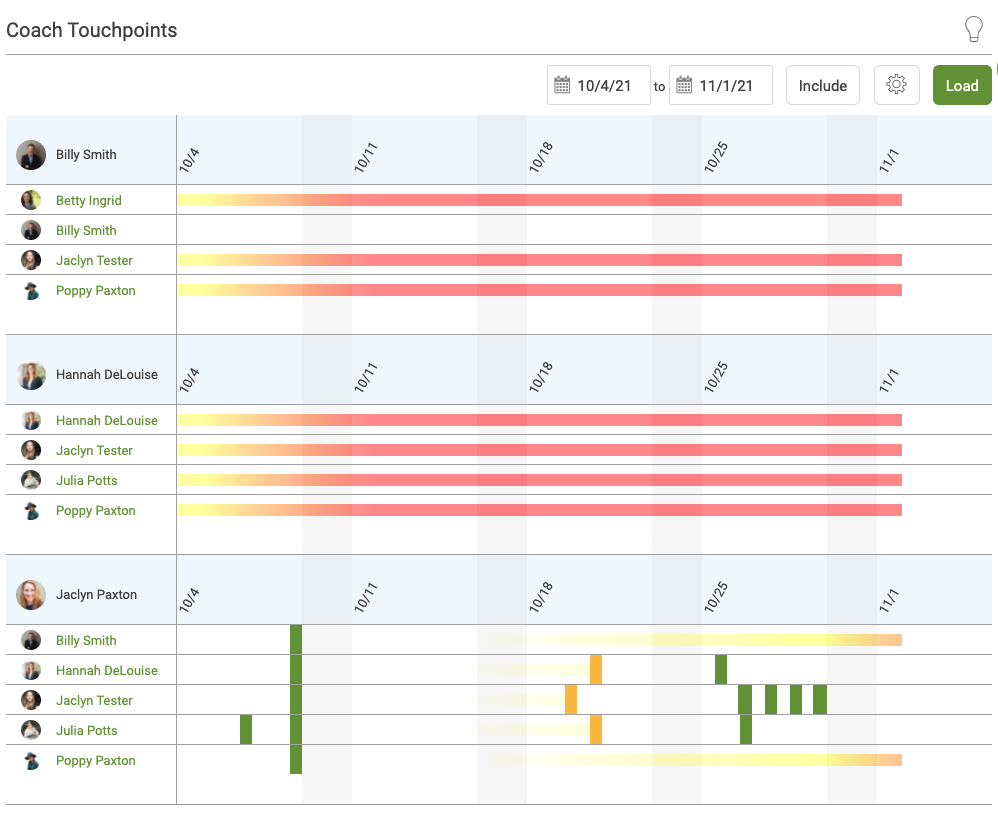
Notice the setup here: good within three days, bad if over five days. That means that all of these green dashes say “great, this coach has been in contact with this particular client within three days”, red ones say, “whoops, they were finally in contact but it was more than five days since their last connection”, and yellow shows contacts that occurred between three and five days.
Also, notice the trails: they show the progression from “we’re fine” to “not so good, it’s now been a while” to “yikes, we’re really letting this client down, interaction-wise!”
Drill Down
From here, you can hover over a date to see what particular interaction(s) occurred on that date.
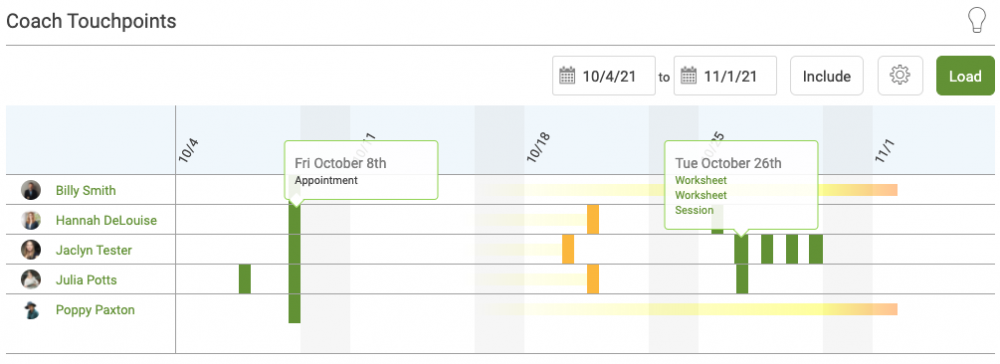
You can then click on the item in question (a Worksheet, Session Note, etc.) to view it.
Added Bonuses
In the example reports above, you might notice that certain coaches aren’t interacting with certain clients at all. That might be an easy indication to update the coach’s client pairings.
Also, perhaps you’ve got a single coach account, rather than a Team Edition account. You can still use the Coach Touchpoints Report to track your own interactions with clients to see if you’re delivering on your promises.
Here’s how it looks for a single coach’s account – notice you’ll see the same indicators as far as “it’s been too long”, “pretty good”, or “great job.”
From here, you can use this data to help train and develop your coaches, give gentle nudges, proactively reach out to clients, and find reasons to acknowledge your coaches, too.